- Written by martial sankar
- Hits: 9572
Analytics & Acquisition Report #1
The first version of HumaReC was launched in March, the 7th. Three months later, is the plateform visited enough ? Are we visible enough on the web ? What can we do to enhance the traffic on our webpage ? HumaReC is happy to share with you glimpses of answers, harvested from our web analytics data.
Background : Semantics of analytics
If you are not familiar with web analytics, keep in mind this cheatsheet :-
General
- session = visit
- av. session duration = average duration of the session.
- bounce rate = pourcentage of user leaving the website without pursuing on other pages or making any interaction (e.g., scrolling or clicking).
- users = visitors.
- organic = visitors acquired from search engine results.
- direct = visitors landing to the website from various type of sources. It ranges from link embedded in an email to typing address on the browser.
- referal = visitors send to the website from any other website sources.
- social = visitors acquired from social media.
A good start
Following the momentous release of the HumaReC plateform (up to 55 sessions at the launch) , the traffic is limited to few sessions per weeks with exception of peaks e.g. 2017-04-10 and 2017-04-17, which likely correspond to cross-references from collaborators blog and new folio releases.
Local institution as primary users
The traffic on the HumaReC plateform arises mainly from local network of collaborations as shown by the top 3 countries in terms of number of sessions c.a.d., Switzerland, Italy and France.
Social media and cross-linking
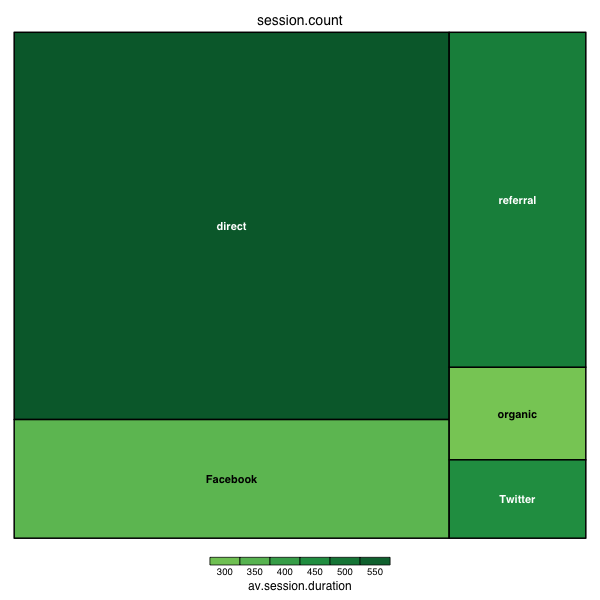
Where does the traffic come from ? The above treemap view depicts the sessions duration as function of the sessions frequency for each source category (i.e., direct, social, referal and organic). Though most of the traffic is direct, social media already represents the quarter of our acquisition. Strikingly, referal-driven traffic (e.g., from external blog post) is interesting, since, despite a fewer number of sessions, their average duration is not neglectable.
Summary And Perspectives
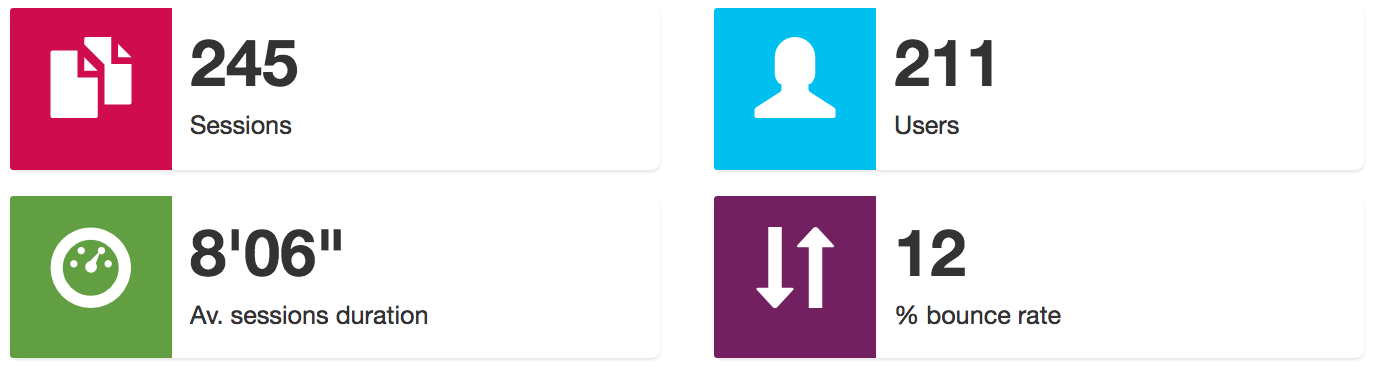
In brief, with a total of 245 sessions and 211 users, a low bounce rate (12%) and a slightly more than 8 min session duration/users, we obviously match our expectation regarding the launch of the HumaReC plateform. It noteworthy, however, that it could be very interesting to cross our observations with the one of other similar projects. It would allow us to have points of comparison. Next directions would likely focus on consolidating and increasing our basis of weekly users. This could potentially be achieved by making HumaReC visible on "scientific" social media, e.g., researchGate or academia.edu) or by making our plateform referenced by specialized websites.
Methods
Web analytic data collection
Web analytics data were collected using google analytics. The collected data were pulled from google using the Google Analytics Core Reporting API Version 3.0. This API permits to build complex query through the provided dimensions and metrics explorer.
Data processing & visualization
After being pulled, the data were subsequently cleaned for bots/spam and traffic that arises from local development. Despite enabling the default option for bot and spider filtering in google analytics, we spotted escaping bots/spam since their visits reports 100% bounce rate and 0 time session duration. Though this behavior can also correspond to user leaving the page without interacting with it. We made the choice to remove them as well from our analytics, focusing on user which perform at least one interaction with the page (e.g., scrolling or clicking). Traffic data generated by local development were filtered based on internal IP and network domain. Cleaned data were then formated and subsequently exported in JSON format for interactive visualization. The line chart and barplot displayed above were obtained with the open-source chart.js library.